

Repair Monitoring
Access the Repair Dashboards
The repair dashboards are composed of two main dashboards: Storage Data Repair and Broken Keys.
To access these dashboards:
In Grafana, click Dashboards. Open the xcore folder and click Storage Data Repair.
In Grafana, click Dashboards. Open the xcore folder and click Broken Keys.
Monitoring Components
Storage Data Repair
Data Repair Status per Storage Service (Data Server)

Metric |
Description |
|---|---|
Data waiting for network repair |
Total size of keys to repair from other servers |
Data successfully repaired over network in the last 24h |
Total size of keys repaired from other servers |
Data waiting for local repair |
Total size of keys waiting to repair locally |
Data successfully repaired locally in the last 24h |
Total size of keys repaired locally |
Local repair jobs with data moved to network repair queue in the last 24h |
Number of keys that could not be repaired locally and sent to be repaired from other servers |
Local repair average duration in the last 24h |
Average time it took to repair data |
Network Repair per Cluster (3 or 6 nodes only)

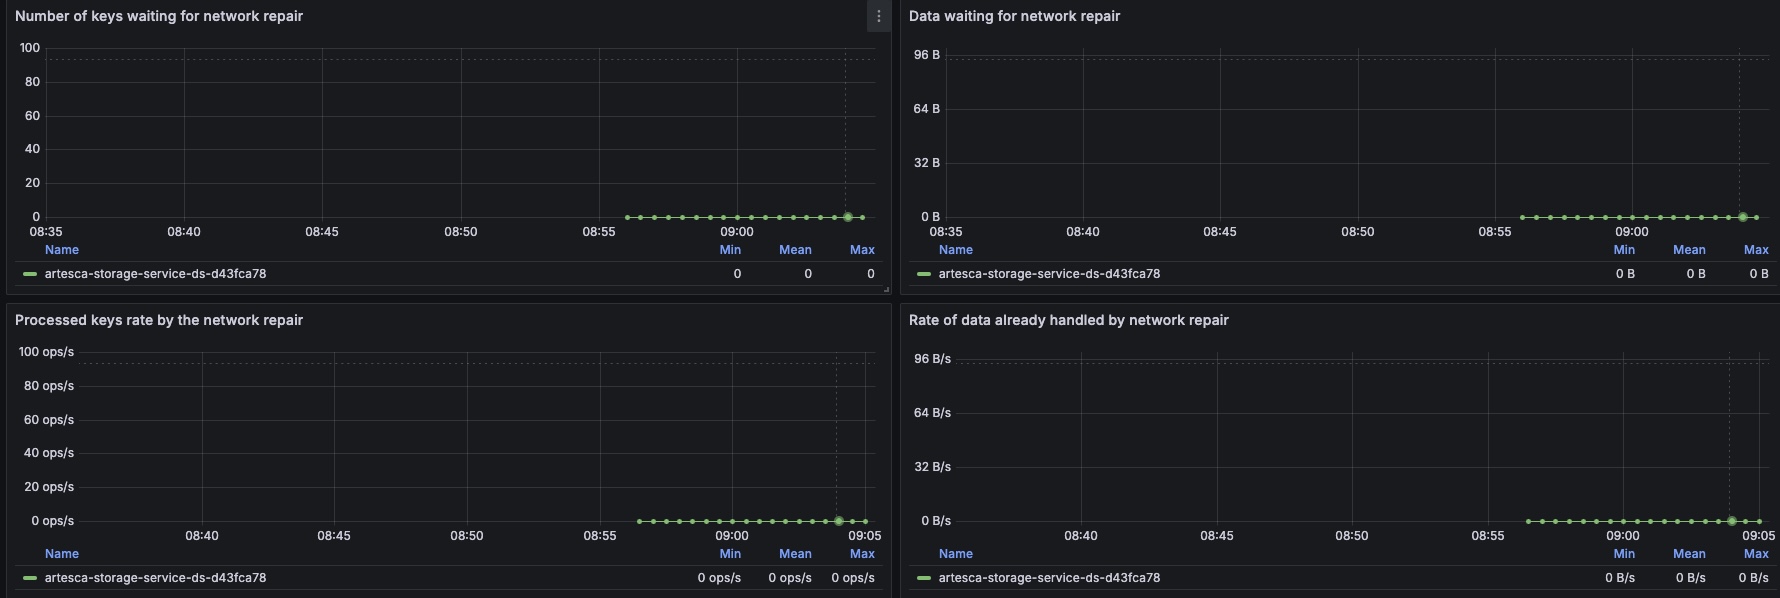
Metric |
Description |
|---|---|
Data waiting for network repair |
Total size of keys to repair from other servers |
Processed keys rate by the network repair from the controller point of view |
Number of repair operations |
Number of keys waiting for network repair |
Number of keys waiting for network repair |
Data waiting for network repair |
Size of data waiting for network repair |
Processed keys rate by the network repair |
Number of network repair operations |
Rate of data already handled by network repair |
Total size of keys repaired over the network |
Local Repair per Server
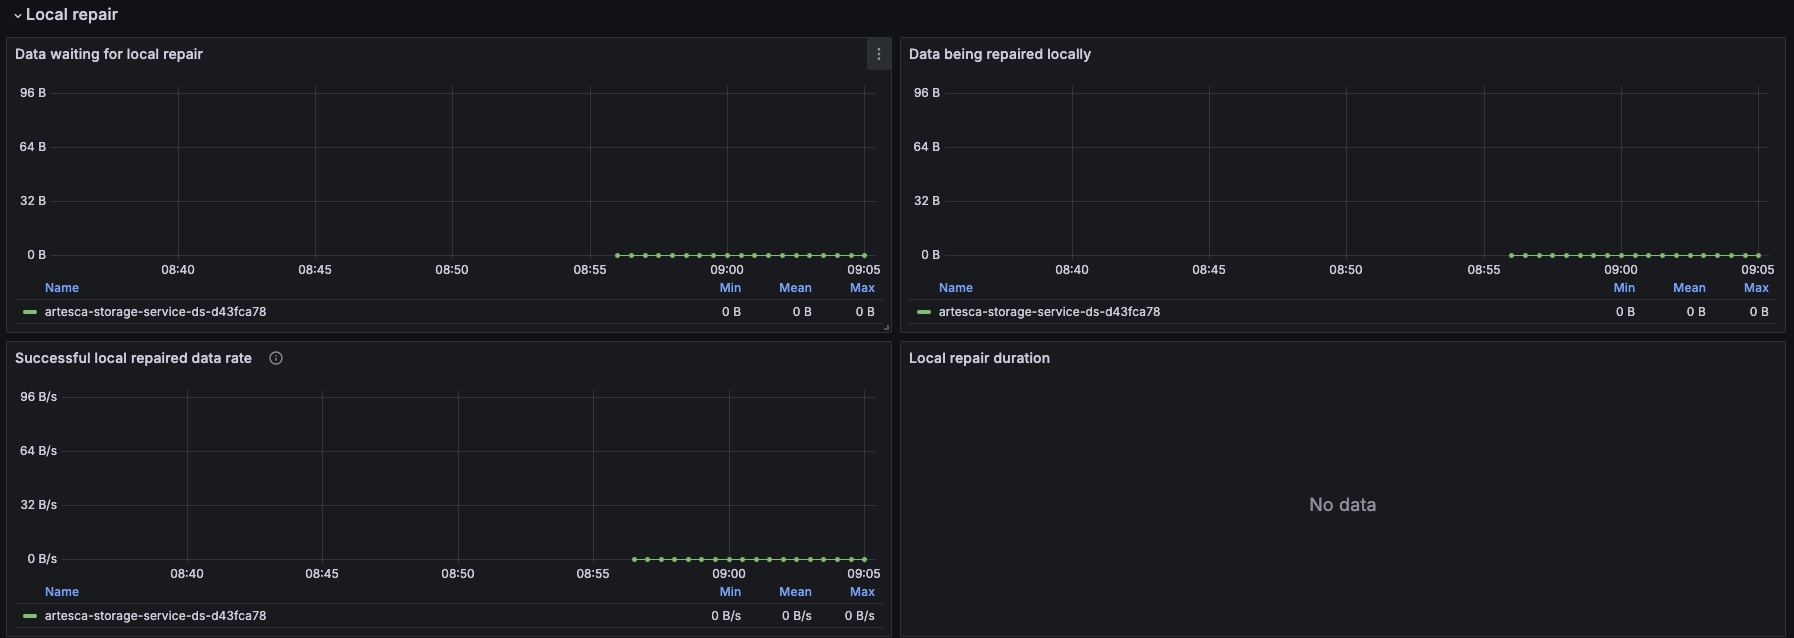

Metric |
Description |
|---|---|
Data waiting for local repair |
Sum of the size of keys to repair from other disks on the same server |
Data being repaired locally |
Sum of size of keys being repaired from other disks on the same server |
Successful local repaired data rate |
Sum of size of keys successfully repaired from other disks on the same server |
Local repair duration |
Time taken to repair data locally |
Rate of local repair ops triggered by HTTP API |
Number of local repair operation per status |
Repair Failures per Server

Metric |
Description |
|---|---|
Rate of data failed to be repaired over network |
Sum of the size of keys that failed to be repaired from other servers over the network |
Local repair jobs with data moved to network repair queue |
Sum of the size of keys that failed to be repaired locally and triggered to be repaired from other servers |
Queues
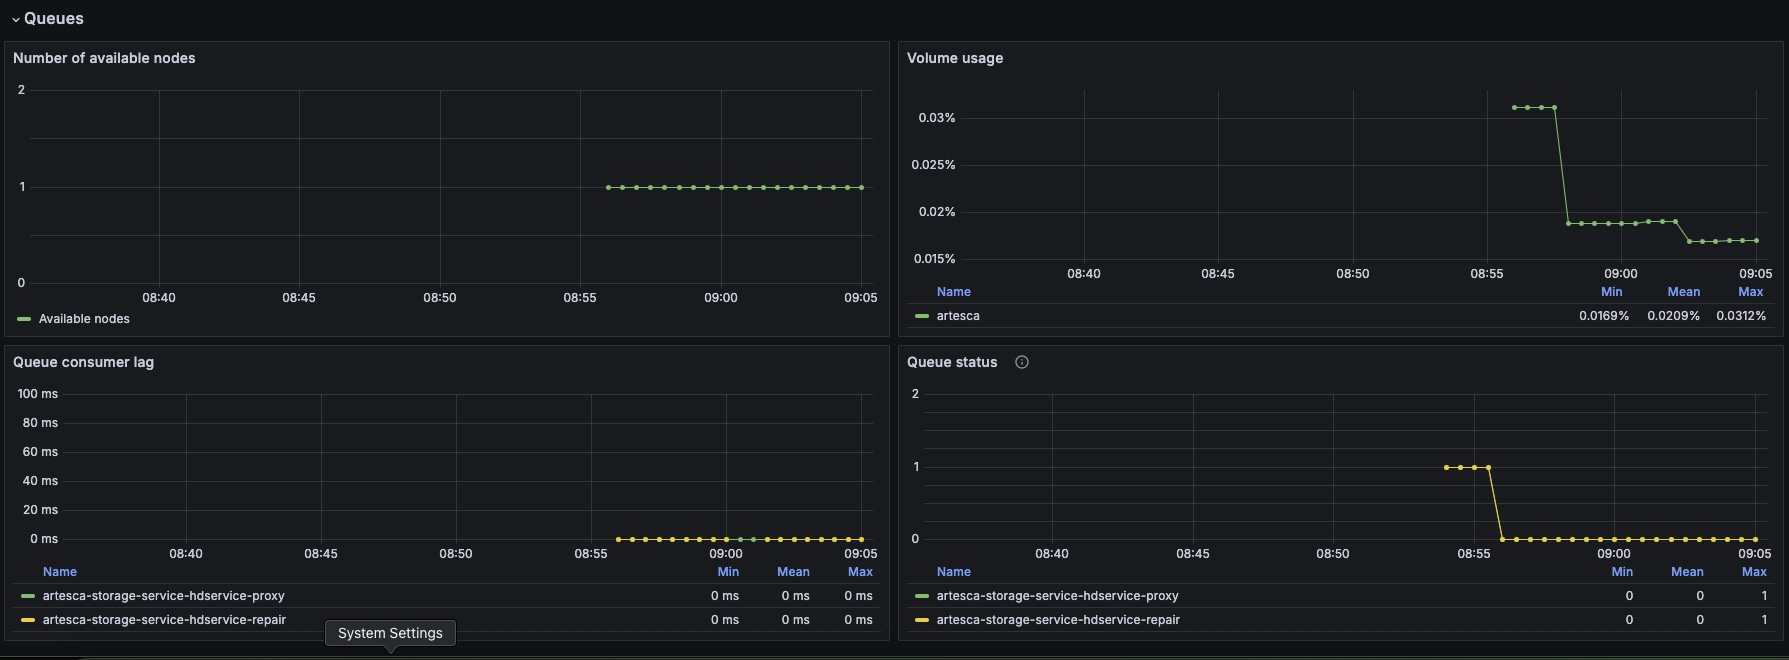
Metric |
Description |
|---|---|
Number of available nodes |
Nodes (servers) available for repair |
Local repair jobs with data moved to network repair queue |
Sum of the size of keys that failed to be repaired locally and triggered to be repaired from other servers |
Volume usage |
Repair volume (on service disk) usage |
Queue consumer lag |
Prediction time between current repair operation and last repair operation |
Queue status |
Status of both services required for repair: 0 - Both are good 1 - One of the services has a problem 2 - Both services have a problem |
Broken Keys
Data to Repair
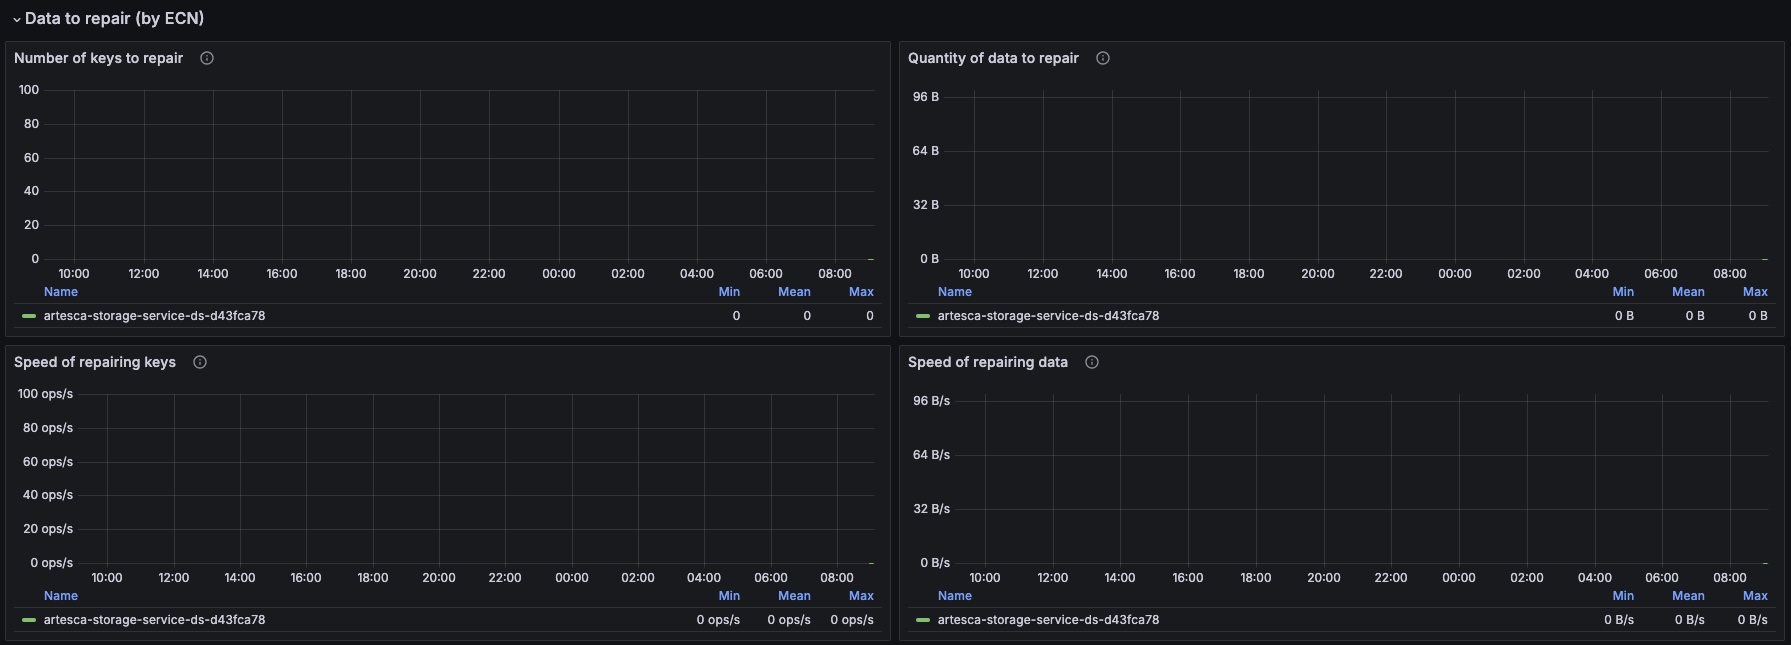
Metric |
Description |
|---|---|
Number of keys to repair |
Number of keys remaining to repair |
Quantity of data to repair |
Size of data remaining to repair |
Speed of repairing keys |
Number of operations of repairing keys per server |
Speed of repairing data |
Total size of repaired keys per server |
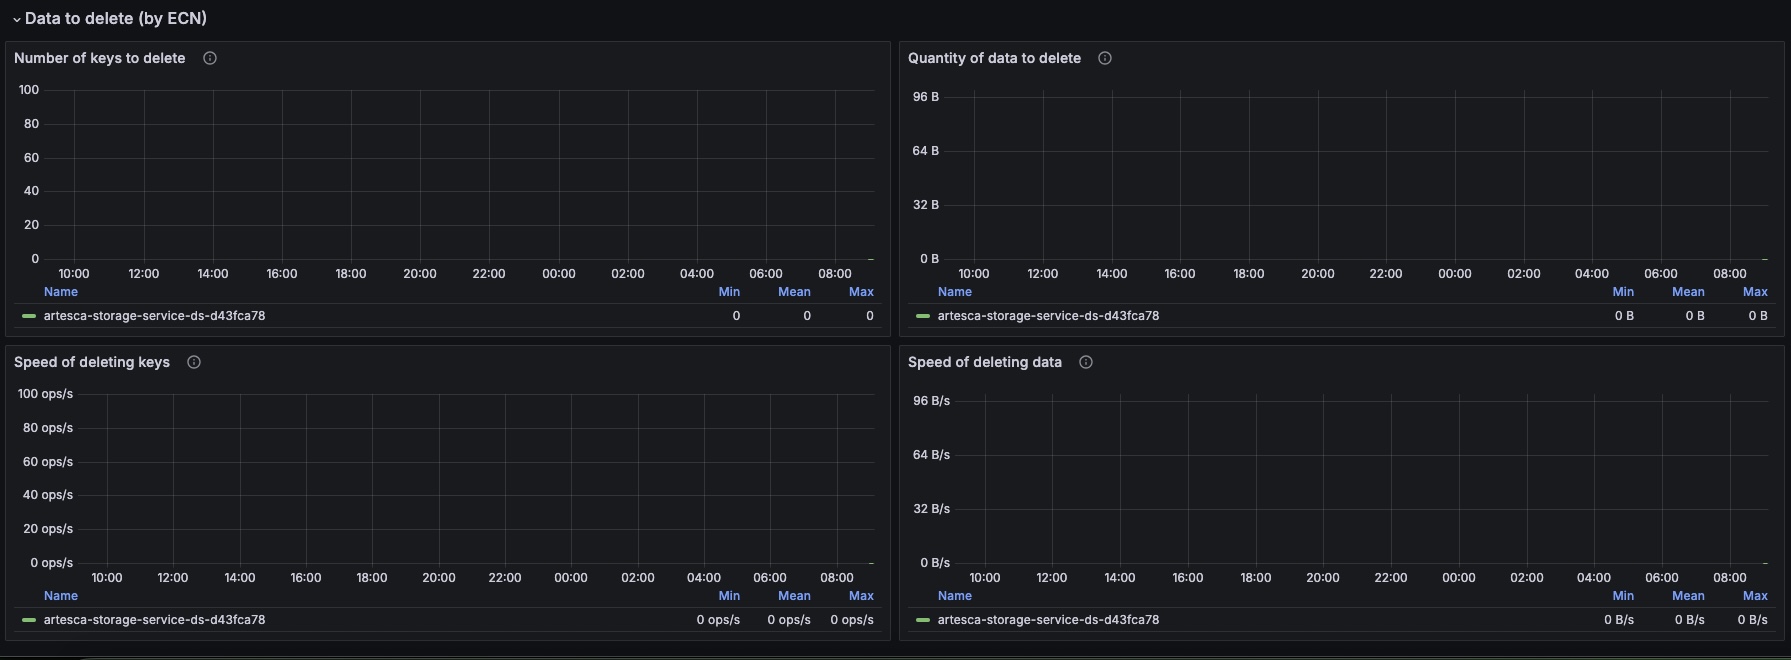
Data to Delete
Metric |
Description |
|---|---|
Number of keys to delete |
Count of objects deleted between time of lost key and repaired key need to be deleted after repaired |
Quantity of data to delete |
Size of objects deleted between time of lost key and repaired key need to be deleted after repaired |
Speed of deleting keys |
Number of operations of deleted keys per server |
Speed of deleting data |
Total size of deleted keys per server |


