

MongoDB Monitoring
Access the MongoDB Dashboards
In Grafana, click Dashboards. Open the Data Services folder and click MongoDB.
Monitoring Components
Health Metrics

Metric |
Description |
|---|---|
Uptime |
Time since the last reboot of that instance. |
Available Connections |
Number of unused incoming connections available. |
Open Connections |
The number of incoming connections from clients to the database server. This number includes the current shell session. The value will include all incoming connections including any shell connections or connections from other servers, such as replica set members or Mongo instances. |
Query Operations |
Queries handled by MongoDB. It is composed of the following:
|
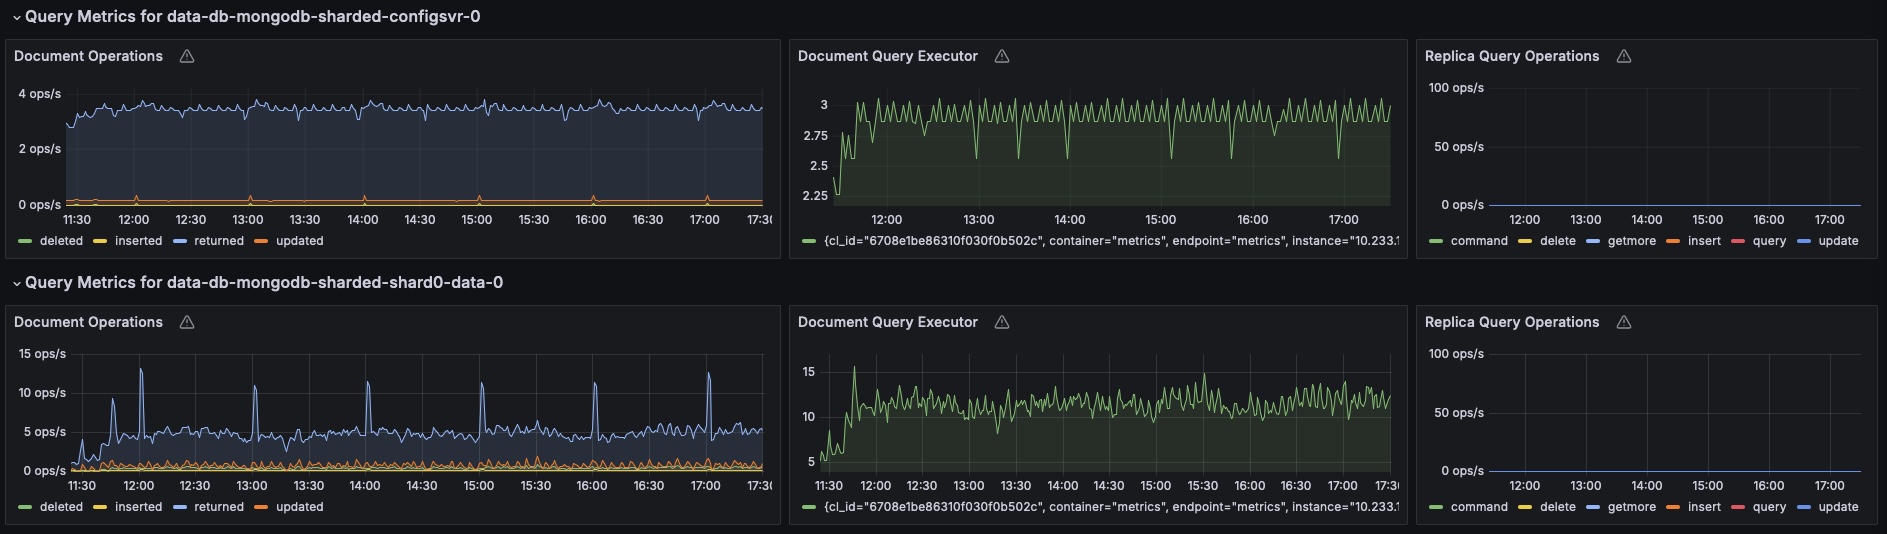
Query Metrics
Metric |
Description |
|---|---|
Document Operations |
Average rate per second of documents returned, inserted, updated, or deleted. |
Document Query Executor |
Average rate per second of query-plan evaluations.
|
Replica Query Operations |
Database replication operations by type. These values only appear when the current host is a member of a replica set.
|
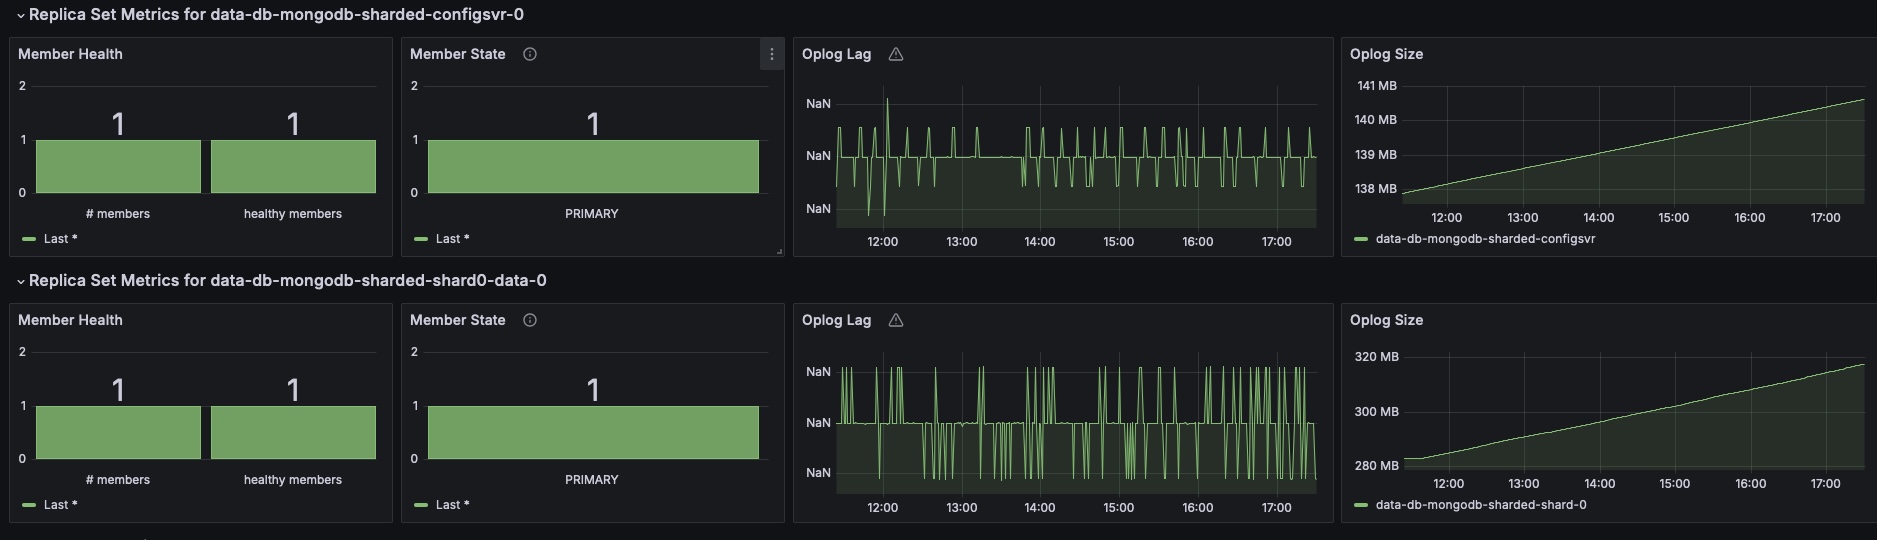
Replica Set Metrics
Metric |
Description |
|---|---|
Member Health |
|
Member State |
State of each member of the replication set. |
Oplog Lag |
Count of operations that modify the data lag on replicas. |
Oplog Size |
Size of operations that modify the data lag on replicas. |
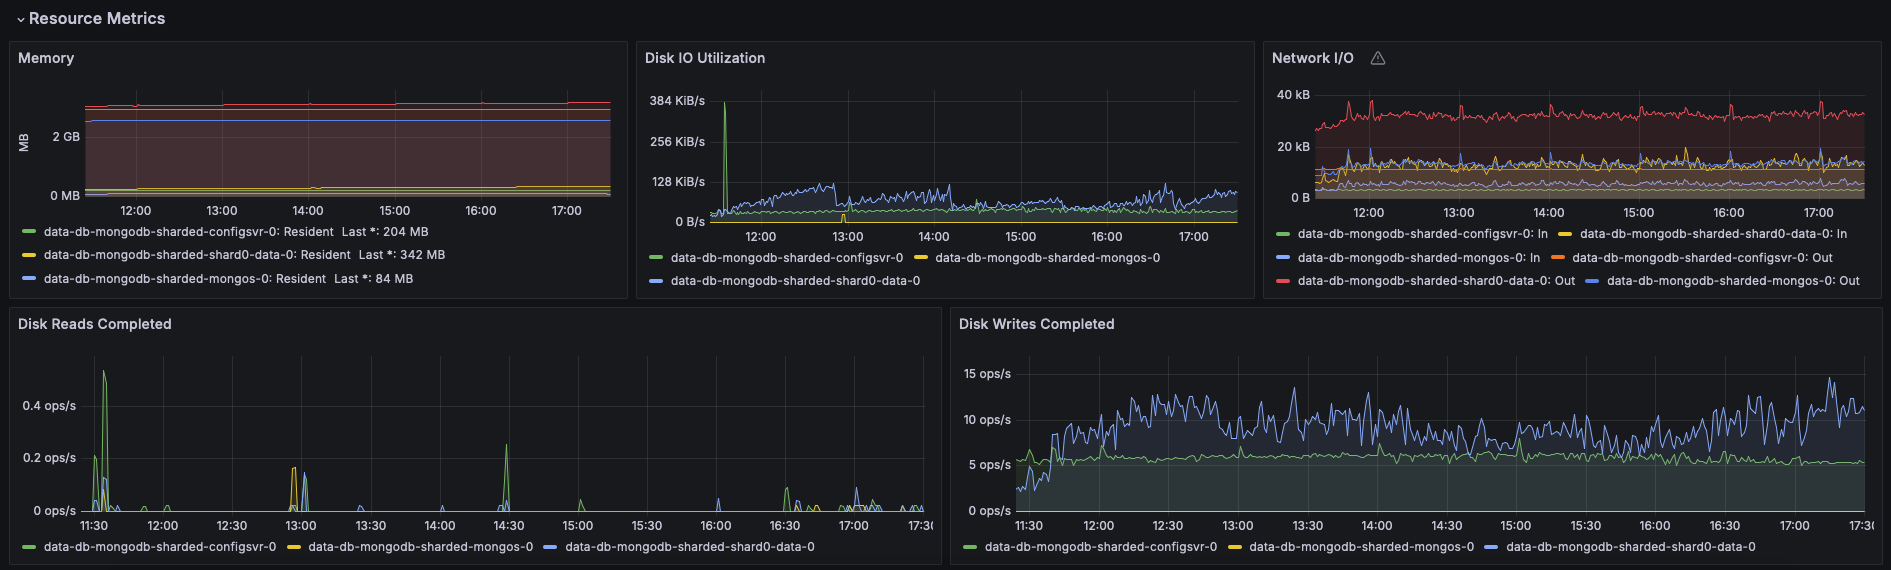
Resource Metrics
Metric |
Description |
|---|---|
Memory |
Per pod memory usage. |
Disk IO Utilization |
Per pod service disk IO. |
Network I/O |
Per pod network usage. |
Disk Reads Completed |
Per pod disk read count. |
Disk Writes Completed |
Per pod disk write count. |


