

Long-term Capacity Monitoring
The Net Capacity chart tracks storage capacity utilization since platform deployment on version 4.1.0 or platform upgrade starting version 4.0.1. Daily data points allow you to monitor and predict storage growth trends.
Access the Net Capacity Chart
The Net Capacity chart is available on the Overview page of the ARTESCA UI.
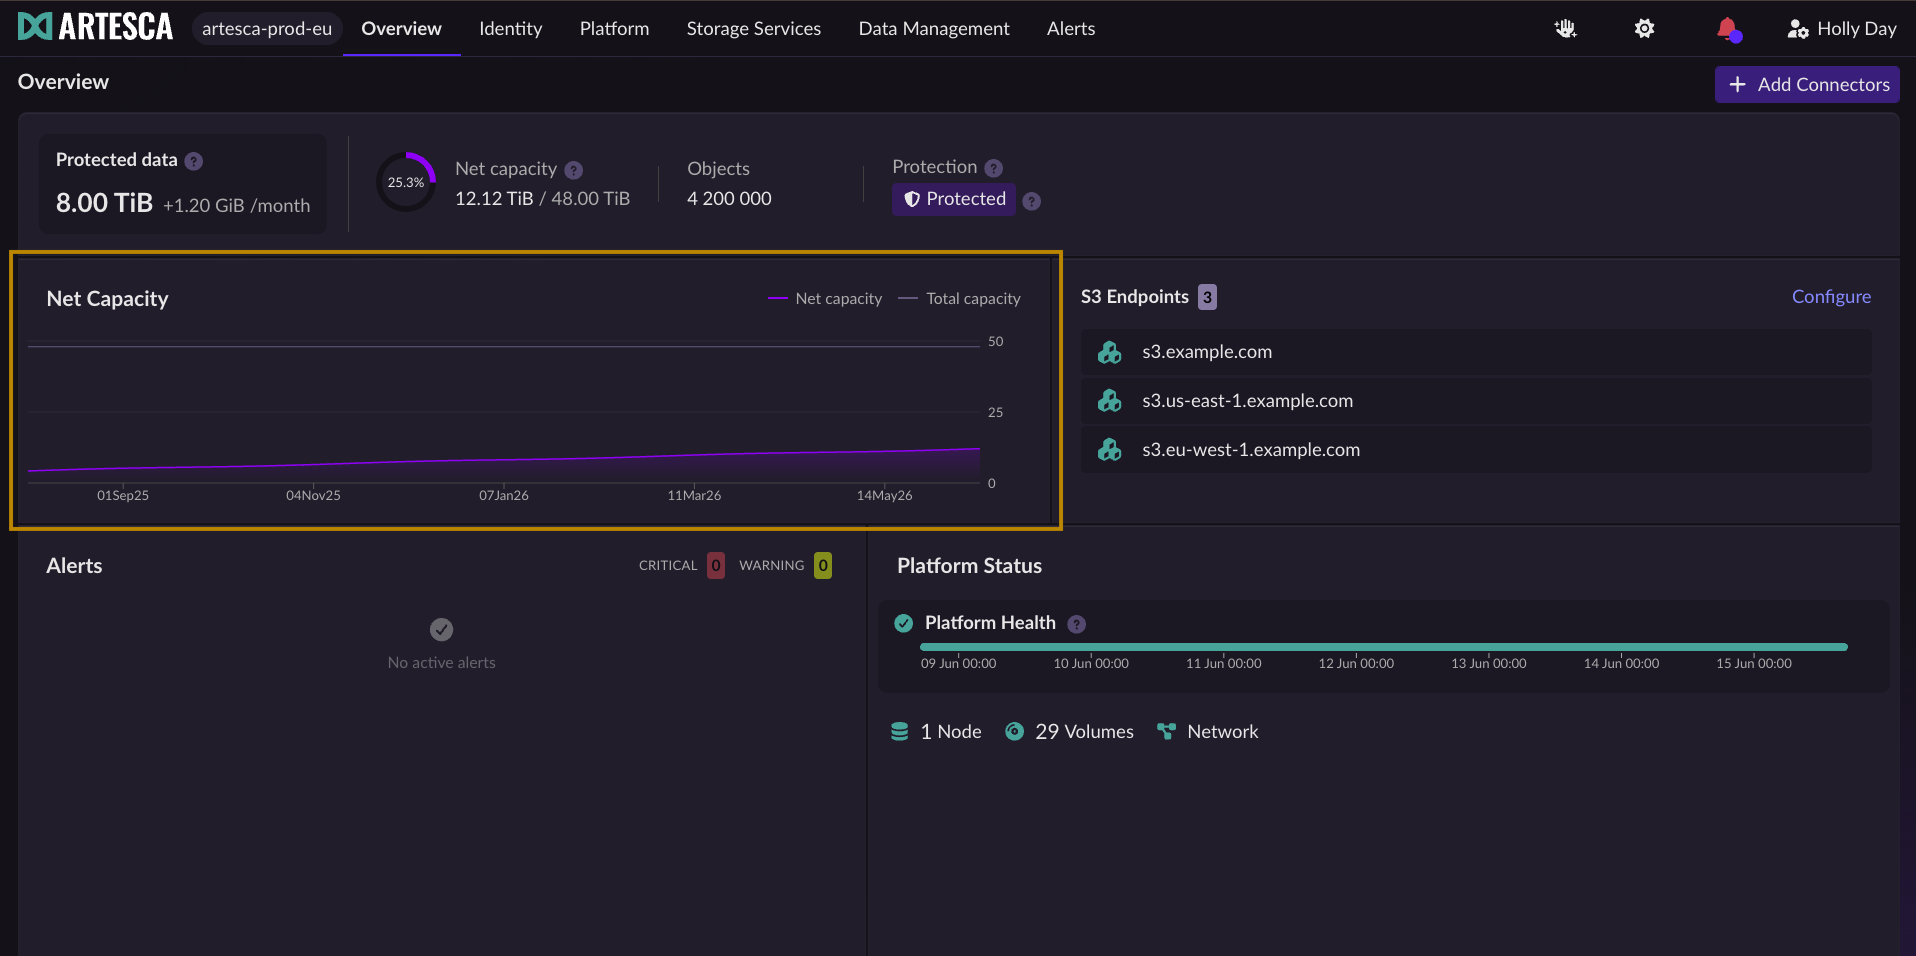
Monitoring Components
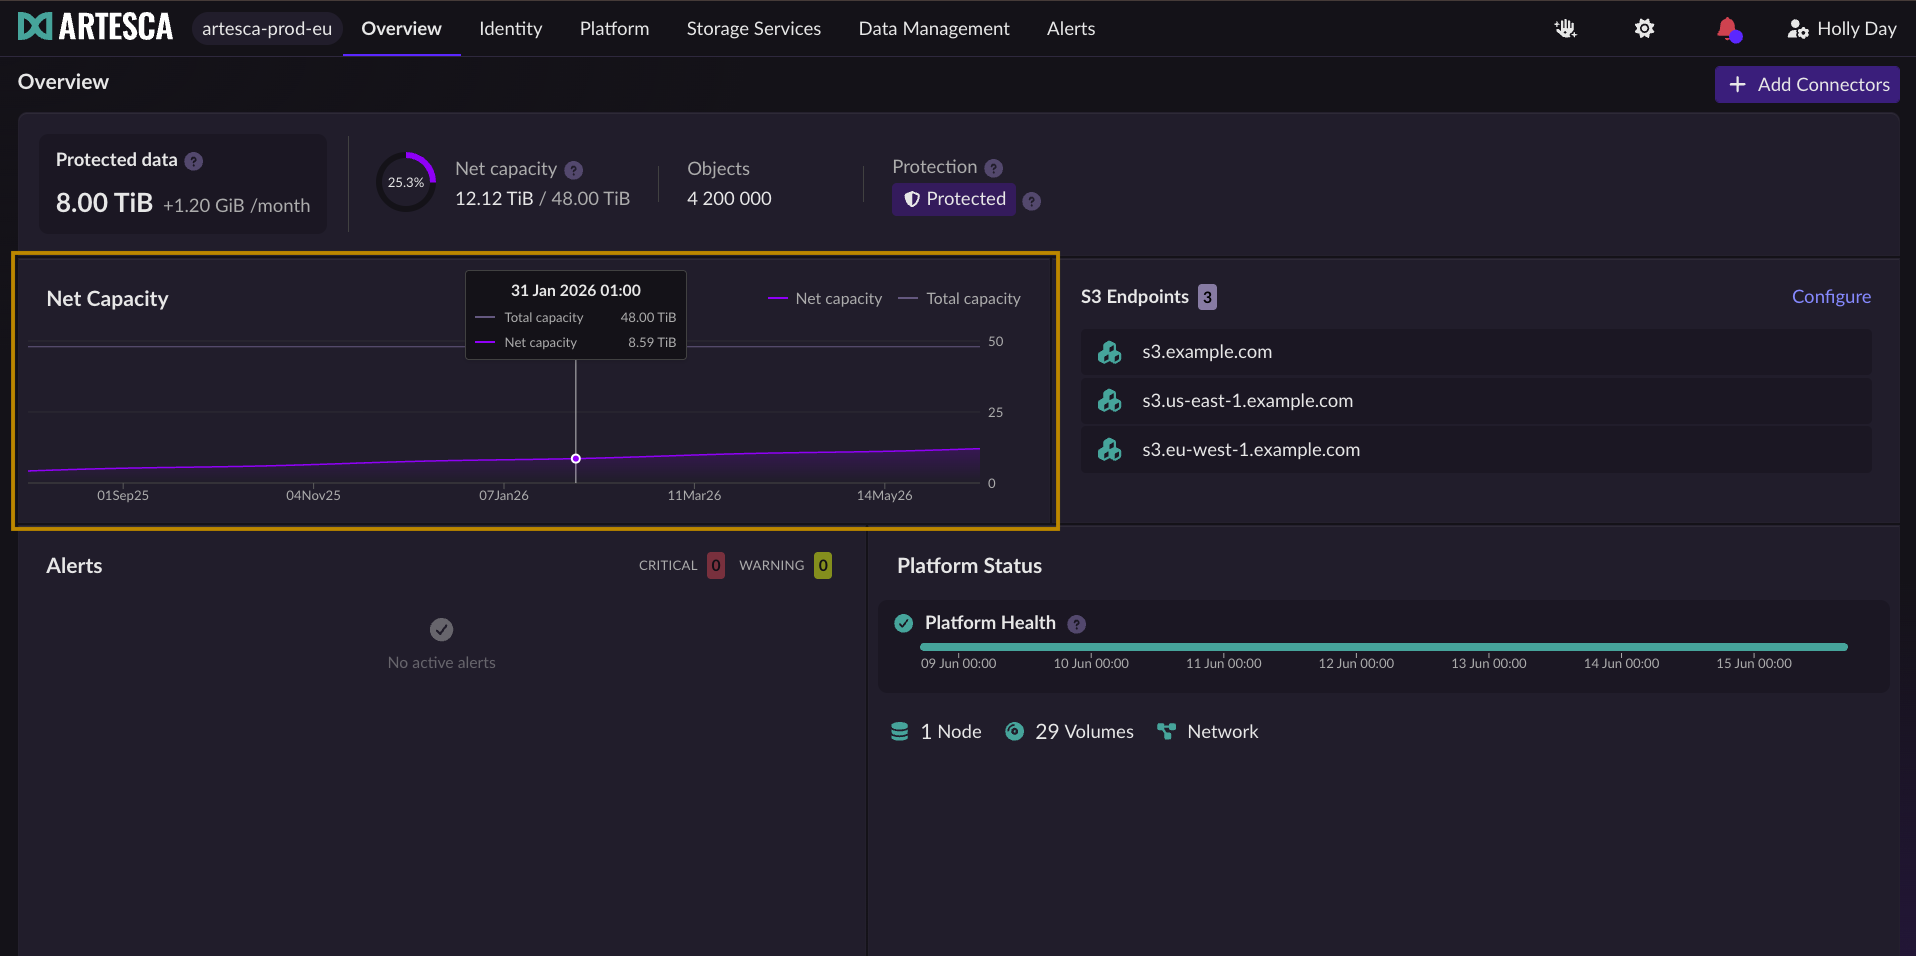
Total Capacity: The top line tracks the total storage capacity of the platform over time.
Net Capacity: The bottom line tracks the used storage capacity of the platform over time.
Time range: The first date is when the metrics start to be recorded. It can match the date of the platform deployment on version 4.1.0 or the date of the platform upgrade starting version 4.0.1. The other dates shown at intervals allow you to see the storage growth over time.


